AICPIN for August 2018 – Stands at 301
(All India Consumer Price Index for Industrial Worker Base Year 2001=100)
AICPIN (CPI-IW BY 2001=100) for the month of August 2018 is stands at 301. No increasing and decreasing in the current level.
AICPIN (CPI-IW BY 2001=100) 10 Points Increased in July 2018
Check DA and DR from 1996: DA Table for CG Employees and Pensioners
No.5/1/2018-CPI
GOVERNMENT OF INDIA
MINISTRY OF LABOUR & EMPLOYMENT
LABOUR BUREAU
‘CLEREMONT’ SHIMLA-171004
DATED: 28th September 2018
Press Release
Consumer Price Index for Industrial Workers (CPI-IW) – August, 2018
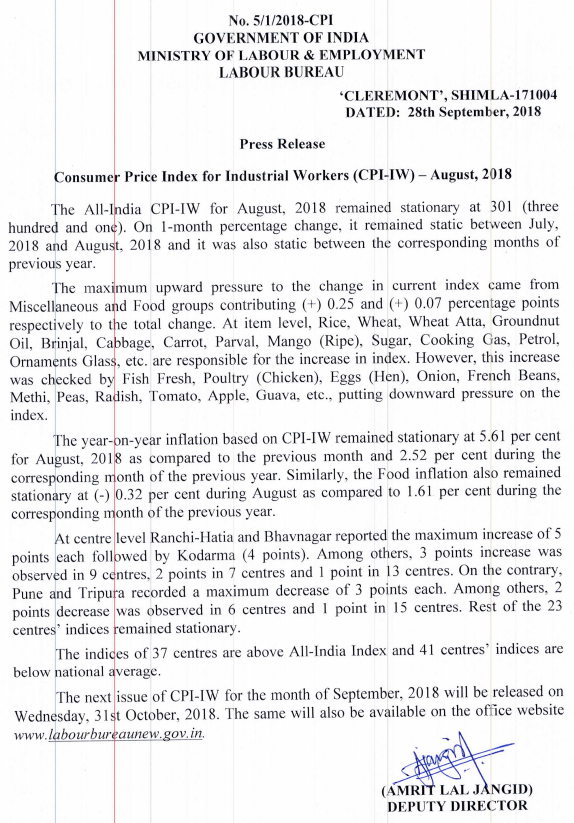
The All India CPI-IW for August 2018 remained stationary at 301(Three hundred one). On 1 month percentage change, it remained static between July,2018 and August 2018 and it was also static between the corresponding months of previous year.
The maximum upward pressure to the change in current index came from Miscellaneous and Food groups contributing (+) 0.25 and (+) 0.07 percentage points respectively to the total change. At item level , Rice, Wheat, Atta , Groundnut Oil, Brinjal, Cabbage, Carrot, parvel, Mango (Ripe), Sugar, Cooking Gas, Petrol, Ornaments Glass, etc are responsible for the increase in index. However, this increase was checked by Fish Fresh, Poultry (Chicken), Eggs (Hen), Onion, French Beans, Methi, Peas, Radish, Tomato, Apple, Gauva etc, putting downward pressure on the index.
The year-an-year inflation based on CPI-IW remained stationary at 5.61 per cent for August, 2018 as compared to the previous month and 2.52 per cent during the corresponding month of the previous year. Similarly, the Food inflation also remained stationary at (-) 0.32 per cent during August as compared to 1.61 per cent during the corresponding month of the previous year.
At centre level Ranchi-Hatia and Bhavnagar reported the maximum increase of 5 points each followed by Kodarma (4 points). Among others, 3 points increase was observed d in 9 centres, 2 points in 7 centres and 1 point in 13 centres. On the contrary, Pune and Tripura recorded a maximum decrease of 3 points each. Among others, 2 points decrease was observed in 6 centres and 1 point in 15 centres. Rest of the 23 centres indices remained stationary.
The indices of 37 centres are above All-India Index and 41 centres’ indices are below national average.
The next issue of CPI-IW for the month of September, 2018 will be released on Wednesday, 31st October, 2018. The same will also be available on the office website www.labourbureaunew.gov.in.
sd/-
(AMRIT LAL JANGID)
DEPUTY DIRECTOR
Source: http://labourbureaunew.gov.in
Expected DA Jan 2019 Calculator
| 2018 | ||||
| Month/Year | CPI | +/- | High | Low |
|---|---|---|---|---|
| JAN 2018 | 288 | +2 | ||
| FEB 2018 | 287 | -1 | ||
| MAR 2018 | 287 | 0 | 287 | |
| APRI 2018 | 288 | +1 | ||
| MAY 2018 | 289 | +1 | ||
| JUN 2018 | 291 | +2 | ||
| JUL 2018 | 301 | +10 | 301 | |
| 2017 | ||||
| Month/Year | CPI | +/- | High | Low |
|---|---|---|---|---|
| JAN 2017 | 274 | -1 | 274 | |
| FEB 2017 | 274 | 0 | ||
| MAR 2017 | 275 | +1 | ||
| APR 2017 | 277 | +2 | ||
| MAY 2017 | 278 | +1 | ||
| JUN 2017 | 280 | +2 | ||
| JUL 2017 | 285 | +5 | ||
| AUG 2017 | 285 | 0 | ||
| SEP 2017 | 285 | 0 | ||
| OCT 2017 | 287 | +2 | ||
| NOV 2017 | 288 | +1 | 288 | |
| DEC 2017 | 286 | -2 | ||
| 2016 | ||||
| Month/Year | CPI | +/- | High | Low |
|---|---|---|---|---|
| JAN 2016 | 269 | |||
| FEB 2016 | 267 | -2 | 267 | |
| MAR 2016 | 268 | +1 | ||
| APR 2016 | 271 | +3 | ||
| MAY 2016 | 275 | +4 | ||
| JUN 2016 | 277 | +2 | ||
| JUL 2016 | 280 | +3 | 280 | |
| AUG 2016 | 278 | -2 | ||
| SEP 2016 | 277 | -1 | ||
| OCT 2016 | 278 | +1 | ||
| NOV 2016 | 277 | -1 | ||
| DEC 2016 | 275 | -2 | ||